The Great Gloom's Grip: Employee Happiness Plummets in Q2
August 14, 2024
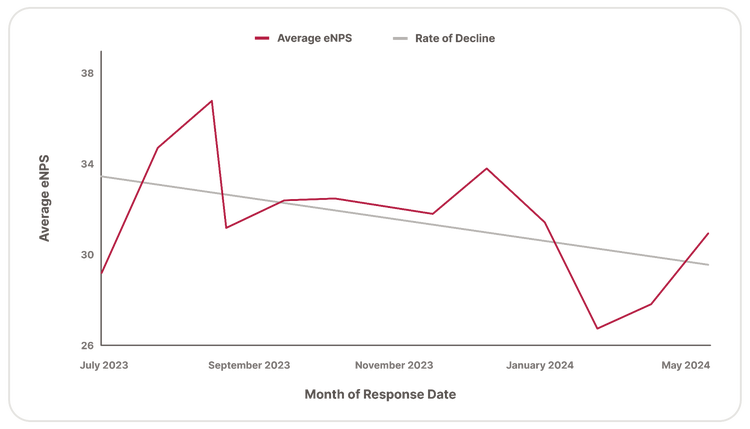
Employee happiness faced a downturn in the second quarter of 2024, casting a shadow of gloom after a brief period of optimism. The 5% decrease from Q1 2024’s average to Q2 is notable, marking a return to the challenging conditions that have characterized recent years.
Will we ever reach pre-pandemic levels of employee happiness? BambooHR analyzed eNPS® data from over 57,000 employees across various industries in this quarterly Employee Happiness Index report to better understand current sentiment.
In this report, we explore the factors contributing to the ever-persistent "Great Gloom," offer HR professionals crucial insights into what the implications may be for their organizations, and discuss what can be done to make a difference for their employees.
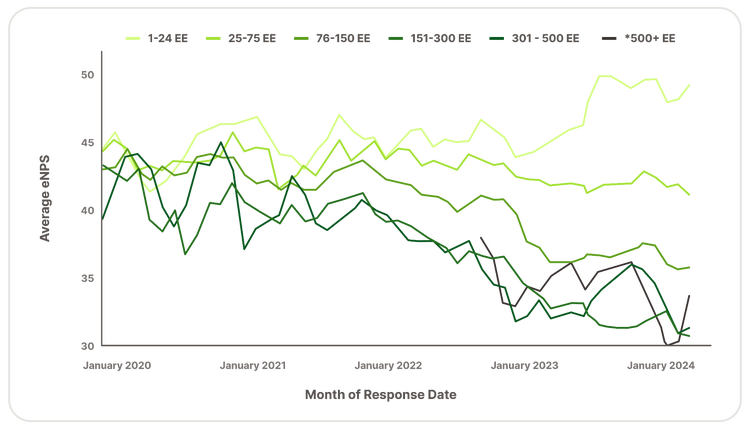
Average eNPS Continue to Fall (2020–2024)
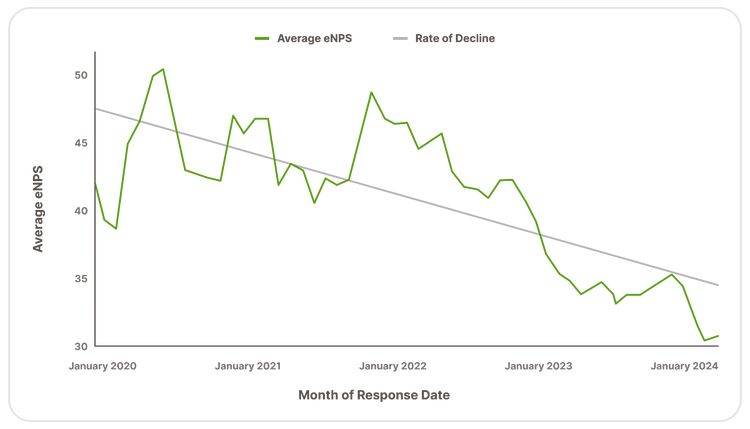
Employee happiness hit a new four-year low in May 2024 (35), a significant drop from 44 in May 2020. While a small dip in Q2 is typical, all of Q2 2024 dropped below a 36, making it the lowest Q2 eNPS we’ve seen. In addition, there was a 5% decrease from June 2023 to June 2024.
Using tools like eNPS surveys, organizations need to conduct thorough assessments to identify the root causes of dissatisfaction among employees. Implementing strategies to improve leadership effectiveness, enhancing employee engagement initiatives, and providing support for the transition back to the office are essential steps to boost morale and overall wellbeing in the workplace.
Organizations should prioritize open communication, listen to employee feedback, and proactively work toward creating a positive and supportive work environment to foster a culture of happiness and productivity.
Editor’s Note: Respondent quotes were sourced from external interviews. All names and identifying information have been changed to protect privacy. Quotes have been lightly edited for clarity and concision.
“The recent eNPS data clearly indicates a troubling trend in employee sentiment, reaching a four-year low this May. This persistent decline throughout Q2 2024, with scores consistently below 36, is alarming and signals a critical need for organizational introspection and action.
As leaders, we must enhance our engagement efforts, support our teams in their workplace transitions, and foster open lines of communication. It’s not just about improving numbers but building a workplace that genuinely prioritizes the well-being and satisfaction of every employee, thereby cultivating a culture of sustained happiness and productivity.”
Anita Grantham | Head of HR | BambooHR
Employee Satisfaction Key Takeaways
Key Takeaways by Employee Group
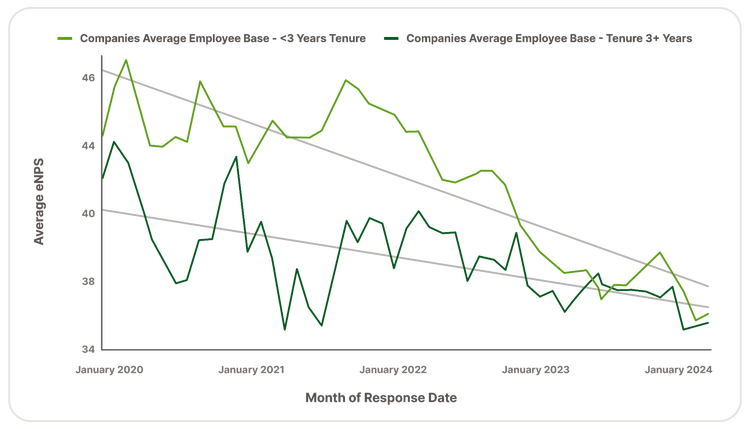
Employee Tenure: The eNPS spike for employees with less than 3 years of tenure in Q1 has stabilized, with similar happiness trends continuing into Q2.
Company Headcount: Larger organizations saw the biggest eNPS dips in Q2.
Key Takeaways by Industry
Construction: Maintained its high average seen in Q1 despite some drops in May and June.
Travel & Hospitality: Q2 happiness dropped 12% after Q1’s high happiness scores.
Finance: Happiness in Q2 stayed low at 36 following March’s new four-year low.
Nonprofit: Q2 dropped slightly in happiness (5%) following Q1’s surge.
Education: Maintained the highest June eNPS the industry has seen in the last 4 years.
Technology: Reached yet another new four-year low in Q2 at 32.
Restaurant, Food, & Bev: Q2 had an expected decline that the industry sees every summer.
Healthcare: eNPS dropped 7% in Q2, a trend seen previously in 2022 and 2023.
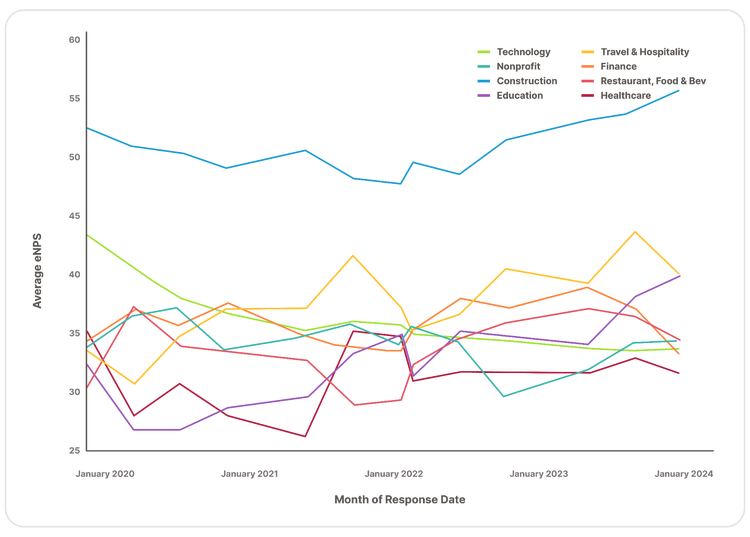
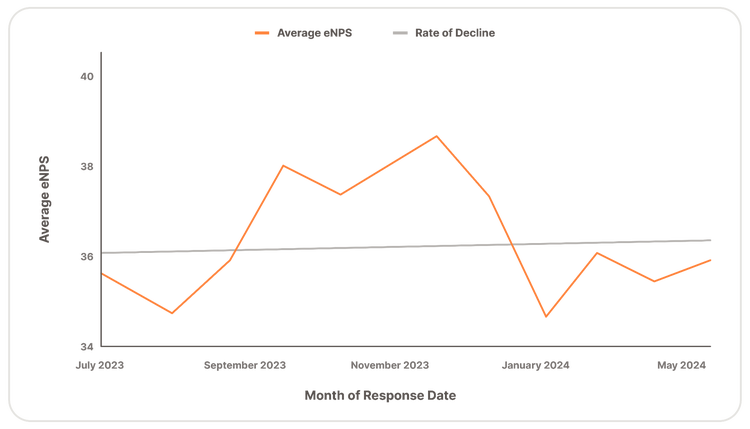
As Most Industries Struggle, Employee Happiness in Construction Soared in 2023 and 2024
The Happiest Employees Work at Businesses with Under 75 Employees
In the second quarter of 2024, the happiest employee groups were those at smaller companies with fewer than 75 employees, which is consistent with what the data showed for Q1.
Additionally, happiness mellowed in Q2 generally, though newer employees are still slightly happier than those with more than three years of tenure.
Across regions, North America remains the happiest for workers, with an average happiness score of 40 in June, while APAC has become the least happy, falling below EMEA with a score of 24. Despite a general decline in happiness across all regions early in the quarter, there was a slight global improvement as June concluded.
Employee Tenure Trends: New Hires Are 2% Happier
Companies with a workforce predominantly composed of newer employees (those with less than 3 years of tenure) experienced a 2% higher average happiness compared to companies with a majority of longer-tenured employees.
One reason for this could be that newer employees simply haven’t had time to burn out, whereas employees who have been at a company for several years—especially in industries like education and healthcare, where burnout is common—might be more susceptible to burnout due to the cumulative effects of long hours, high stress levels, and emotional demands of their jobs.
“I'm feeling burned out early in my career and I’m still young, so I worry how I'll feel when I get older,” said a healthcare worker at a small, private company. “It's tiring. I can't foresee myself doing this forever.”
For HR professionals and their organizations, it’s important to proactively recognize signs of burnout and intervene early, or they may lose valuable employees.
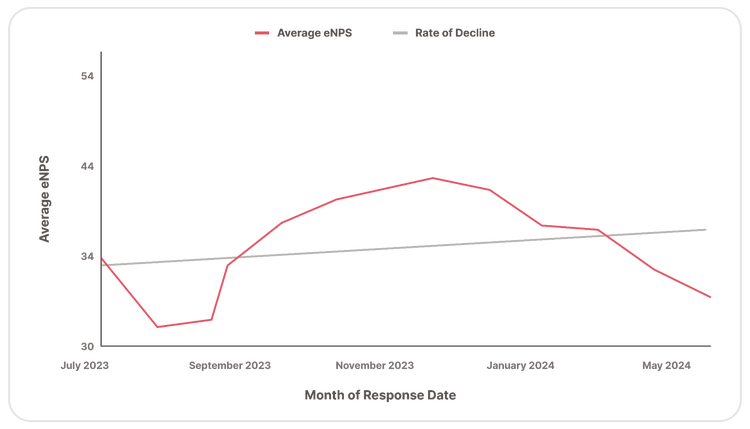
Employee Tenure Average eNPS 2020–2024
The Smaller the Company, the Happier the Employees
“Even if you have a large business, if you treat it like a small business—breaking into groups and categories and having those people get together—I think that's really amazing for camaraderie.”
Co-owner of a Remodeling Company | Small Construction Company
Company Headcount Average eNPS Q2 2024
“This is an important reminder that a well-defined talent philosophy is essential, especially for growing organizations. For large companies, it provides a framework to manage vast human resources effectively, ensuring alignment with strategic goals and reducing turnover. Meanwhile, small companies benefit immensely as it allows them to compete for top talent by offering a clear value proposition and culture fit, which is crucial in today’s competitive job market.”
Anita Grantham | Head of HR | BambooHR
Breaking Employee Satisfaction Down by Industry
Industries Ranked from Happiest to Unhappiest
Construction
Construction Average eNPS 2023–2024
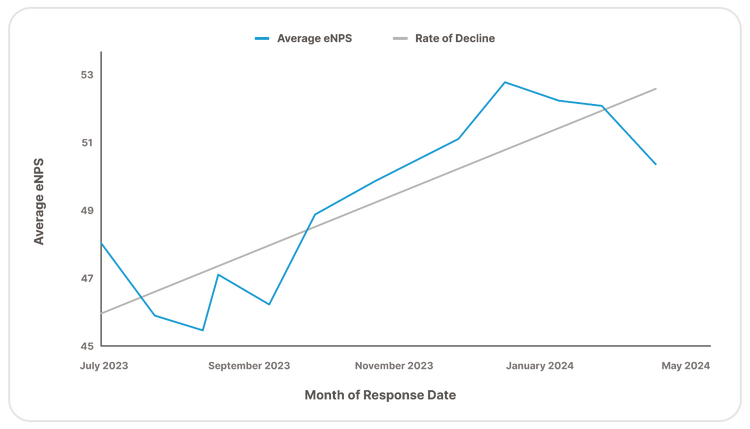
- Maintained high average seen over previous months
- Average eNPS of 52, the same as in Q1
- Compared to June last year, construction is 3 eNPS points higher, a 7% increase
The average eNPS of 52 remains unchanged from Q1, though there was a marginal increase of less than 1%. This indicates a small positive shift in employee sentiment, which could be due to minor improvements in workplace conditions, policies, or employee engagement strategies.
Comparing the eNPS of June 2024 to June 2023, there’s a 3-point increase, translating to a 7% improvement. While it’s difficult to pinpoint the causes of happiness in the construction industry, one common theme among many of our respondents was the satisfaction of seeing the finished product they helped create:
“I like the role, and I'm getting more involved in how to expand it. I love construction. There's just something about visually seeing my work put in place.”
Coordinator | Construction Company
“It's very fun and rewarding. It’s so fun to see when clients look at what has been done and how everything has been transformed. I love that. So I'm very happy.”
Co-owner and Designer | Construction Company
Nonprofit
Nonprofit Average eNPS 2023–2024
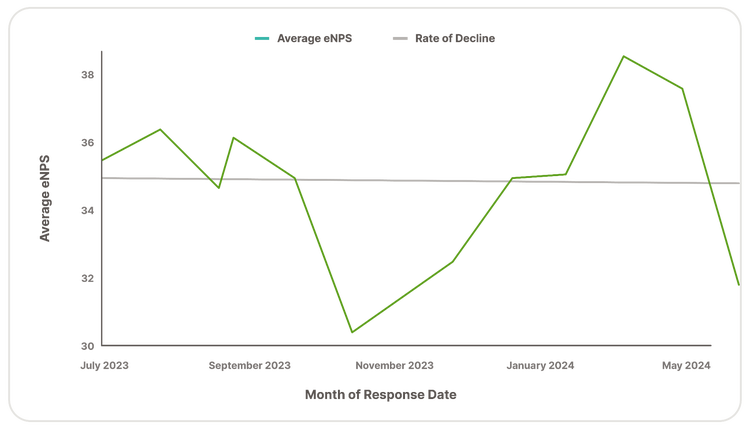
- Since December 2023’s four-year low, eNPS has increased 13%
- Average eNPS in Q2 is 34, the same as Q1
- eNPS is the same as March 2023
The quarter ended on a less positive note, with June 2024 recording an eNPS of 32, which is 3 points lower than June 2023, indicating a 6% year-over-year decrease. This decline in June could reflect seasonal variations, specific events, or emerging challenges that may need to be addressed to sustain or improve employee sentiment in the sector.
At the end of the day, it seems working for a mission-based organization where they can see their impact is what drives many employees in this field: “There are hard days when it's busy and there's a lot of paperwork, and general intensity and stress. But I'm happy because I'm very connected to the mission. I believe in what we do.”
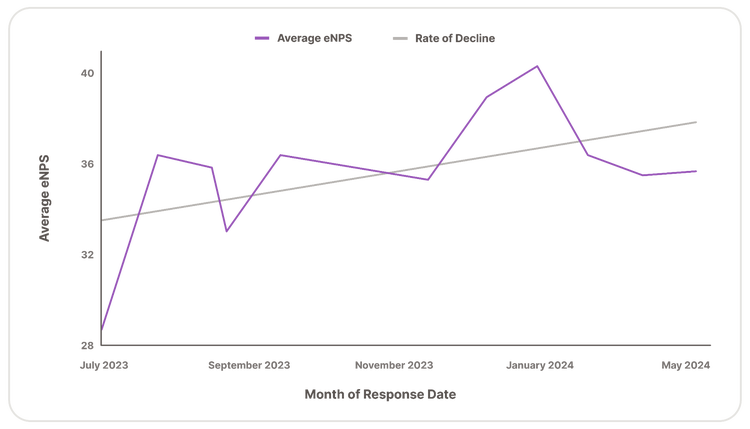
Travel & Hospitality
Travel & Hospitality Average eNPS 2023–2024
- Q1’s eNPS increase didn’t hold as Q2 is 5 points lower
- Average eNPS of Q2 is 36, with Q1 being 41
- 12% decrease from Q1 to Q2
- Compared to June last year, travel & hospitality is 1 eNPS point higher, a 3% increase
Despite this decrease, there was a slight improvement when viewed on a year-over-year basis for June. The eNPS in June 2024 was 1 point higher than in June 2023, indicating a 3% increase. This improvement, although modest, suggests some recovery or positive adjustments in the industry compared to the previous year.
Finance
Finance Average eNPS 2023–2024
- Average eNPS dropped 1 point, or 3%, from Q1 to Q2, now at a 36
- Happiness staying on track with the four-year low that ended out Q1 in March
- Compared to June last year, eNPS is 2 points lower, a 5% decrease
Historically, the June eNPS data from 2020 to 2024 shows a significant decline from 44 in June 2020 to 35 in June 2024. The highest eNPS was observed in June 2020 at 44, and it has generally trended downward since then, with minor fluctuations.
One employee in the finance sector described this downward trend as it relates to increasing inflation:
"We're as happy as the stock market is in this business."
Investment Advisor | Service Brokerage Company
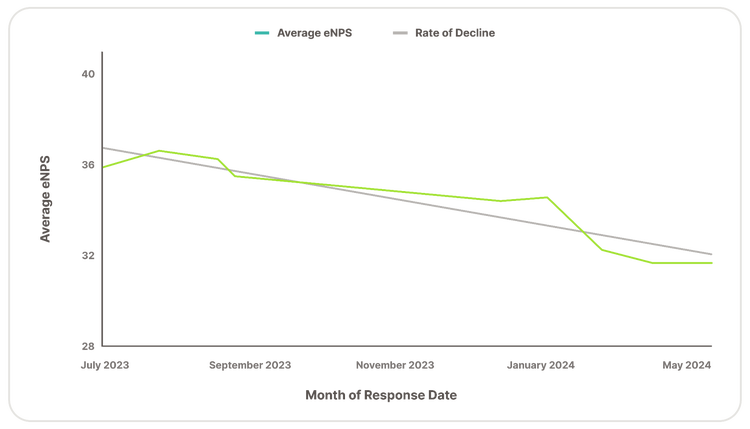
Education
Education Average eNPS 2023–2024
- Education happiness dropped in Q2 as expected, following the trend of previous years
- Average eNPS in Q2 was 35, with Q1 being 38
- 6% decrease from Q1 to Q2
- Compared to June of last year, though, eNPS is 5 points higher, an 18% increase
- Highest June eNPS of the last four years
While a drop in happiness as summer begins might be surprising, it’s not uncommon for teachers to experience feelings of anxiety as they transition to a completely new schedule—and in some cases, lower income—for summer break.
An employee working in the e-learning industry said they “feel they have a sense of purpose” in their work and that “educators are changing lives,” which contributes significantly to their happiness.
However, multiple employees we interviewed cited pay as being the biggest challenge for educators. This is in line with research from PEW, which found that “teachers get the most satisfaction from their relationship with fellow teachers and the least satisfaction from how much they’re paid.”
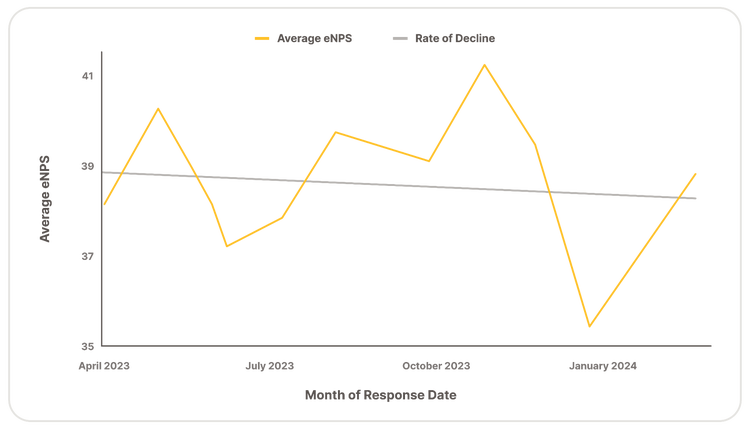
Restaurant, Food, & Beverage
Restaurant, Food, & Bev Average eNPS 2023–2024
- Q2 continued to trend downward, typical for the industry during the summer months
- Average eNPS of Q2 is 34, with Q1 at 37
- 8.1% decrease Q1 to Q2
- Compared to June last year, restaurant, food & bev is 2 eNPS points lower, a 6% decrease
This pattern highlights a persistent challenge in maintaining employee satisfaction during this period. One reason for this could be the extreme heat that often affects workers in this industry in the summer. From South Carolina to Texas and beyond, food service employees are suffering from heat-related illnesses and fatigue, to the point that some kitchen workers are demanding federal protections.
Technology
Technology Average eNPS 2023–2024
- May and June both were four-year lows (32) for tech, with the lowest eNPS since 2019
- Average eNPs of Q2 is 32, compared with Q1 at 35, a 7% decrease from Q1 to Q2
- Compared to June of last year, technology eNPS is 5 points lower, a 13.8% decrease
The general sentiment among tech employees was that “not much is going well right now.” Many cited the persistent layoffs over the past couple years as well as inflation.
“I’m not really sure there is much going well in my industry. The economy is not good, and it’s a tough time to be in this type of role.”
Purchaser | Ecommerce Company
Healthcare
Healthcare Average eNPS 2023–2024
- Q2 showed a 7% decrease from Q1’s average
- The decrease is mostly brought down by low scores in April and May, with June beginning to recover to Q1 levels
- Average eNPS dropped 2 points from 33 in Q1 and is now at a 31 in Q2
- Compared to June of last year, healthcare is 2 points higher
- Increase of 6% from June 2023 to June 2024
Many respondents have cited compensation as the number one reason for their level of unhappiness within this industry. One employee who is a caregiver summarized this sentiment, saying, “We are definitely underpaid and undervalued.” Earlier last month, UK healthcare workers went on strike, demanding better pay.
How Can HR Professionals Help Increase Happiness Among Employees?
Besides compensation, which most HR professionals have no control over, there are a lot of ways to increase employee happiness. Here are several areas many respondents felt had room for improvement, and what to do about it:
- Encourage Work-Life Balance: Help employees find a balance between work and personal life to prevent burnout. Promote the importance of taking time off and engaging in hobbies outside of work.
- Give New Challenges: Provide opportunities for employees to take on new challenges, ensuring they are manageable to avoid overwhelming them.
- Offer Recognition: Recognize and respect the essential skills employees bring to the organization. Provide a way for employees to show recognition to one another in creative ways.
- Create Purpose and Contribution: Foster a sense of purpose by ensuring employees understand how their work contributes to the organization's goals and the broader community.
- Start Support Groups and Social Events: Create voluntary support groups where employees can discuss issues and seek peer support. Organize social events and activities to build camaraderie and a sense of community.
- Include Feedback Mechanisms: Ensure that feedback mechanisms are genuine and inclusive, allowing employees to voice their opinions and feel heard.
- Show Empathy and Support for Wellbeing: Show empathy and support for employees' wellbeing, particularly in high-stress industries. Advocate for better work-life balance and mental health support to prevent burnout.
What’s Employee Net Promoter Score (eNPS)*?
eNPS helps employers measure employee satisfaction. It consists of a numeric rating of how likely employees are to recommend the organization as a place to work. Employees select a score from 0–10, and these scores, categorized as Promoters (9 or 10), Passives (8), and Detractors (7 or below), are used to quantify how employees feel about their company.
The eNPS score is then calculated by taking the percentage of Promoters and subtracting the percentage of Detractors. The resulting score can range from -100 to +100, with higher eNPS scores indicating a higher level of employee satisfaction and loyalty:
- Above 0 is good.
- Above 20 is favorable.
- Above 50 is excellent.
- Above 80 is world class.
*Net Promoter, NPS, and the NPS-related emoticons are registered U.S. trademarks, and NetPromoter Score and Net Promoter System are service marks, of Bain & Company, Inc., NICE Systems, Inc. and Fred Reichheld.
About BambooHR
BambooHR® is the leading HR software solution that sets people free to do great work, by managing the complex work of supporting employees and succeeding as a business, while giving leaders all the data they need to make informed strategic decisions.
Intuitively designed and easy-to-use benefits administration, payroll, performance, time tracking, and reporting where everything works together means less focus on process and more focus on growing what matters most—people.
Over the past 15 years, BambooHR has been the trusted partner of HR professionals at 33 thousand companies with employees in over 190 countries and 50 industries, supporting millions of users throughout their employee experience.
Methodology
All source data is from BambooHR® Employee Satisfaction, gathered between January 2020 and March 2024, and includes more than 1,600 companies, tracking anonymized responses from over 57,000 unique employees since January 2020. Data analyzed includes more than 1.91 million self-reported eNPS scores. The most recent quarter’s data is added to the historical data set on the first day of the new quarter.
Industries included are healthcare, finance, construction, travel and hospitality, nonprofit, restaurant / food and beverage, education, and technology.
Further demographics included are company region, company headcount, and average employee tenure at a company.
Looking for More HR Data Insights? Keep Reading
BambooHR Workforce Insights
Read the latest report to see how hiring, job openings, turnover, review, and PTO trends are changing every month.
Compensation Trends for 2024: Deflation, Transparency, and Benefits
24% of workers say they’d be willing to take a salary cut if it meant job security for the next year. Read the report to understand how workers are feeling and why.
The New Surveillance Era: Visibility Beats Productivity for RTO & Remote
What exactly is the Green Status Effect and who is more productive, remote or in-office workers? Check out the 2024 report to find out.